Data Visualization with Tree Map
This is a guided walkthrough to make a Treemap Diagram Data Visualization Project from the beginning to the end. We import some data on the video game sales, create a hierarchy and visualize them a treemap diagram where the area of the tile is proportional to the revenue by using D3.
Notes
1. Project Setup
Looking at what we need to create and talking through the structure of the task.
- Create skeleton page, set title
- Import D3
- Create and link script page
- Create and link stylesheet
- Create svg canvas with id
- Set body display and svg bg
1
2
3
4
5
6
7
8
9
10
11
12
13
14
<head>
    <meta charset="UTF-8">
    <meta http-equiv="X-UA-Compatible" content="IE=edge">
    <meta name="viewport" content="width=device-width, initial-scale=1.0">
    <title>Tree map</title>
    <script src="https://d3js.org/d3.v5.min.js"></script>
    <link rel="stylesheet" href="./style.css">
</head>
<body>
    <div id="main-wrapper">
        <svg id="canvas"></svg>
    </div>
</body>
<script defer src="./script.js"></script>
1
2
3
4
5
6
7
8
9
10
11
12
13
14
15
16
17
18
19
* {
    font-family: 'Roboto', sans-serif;
    min-height: 100%;
}

body {
    background-image: radial-gradient( circle 610px at 5.2% 51.6%,  rgba(5,8,114,1) 0%, rgba(7,3,53,1) 97.5% );
    display: flex;
    flex-direction: column;
    align-items: center;
    text-align: center;
    justify-content: center;
}

svg {
    background-color: rgb(56,58,74);
    /* border: solid 1px darkgreen; */
    margin: 10px;
}
2. Create variables and functions
- videoGameUrl simply has a string with the url of the json file with our data
- videoGameData will store the data we import as a javascript object
- canvas is a d3 selection of the svg canvas by its id
- drawTreeMap() is a function to create the treemap once we have imported our data
1
2
3
4
5
6
7
8
9
10
11
12
13
14
15
16
17
18
19
20
21
22
23
24
25
26
27
28
29
30
31
32
33
34
35
36
37
38
39
40
41
42
43
//Fetching data from the Api
var videoGameUrl = 'https://cdn.freecodecamp.org/testable-projects-fcc/data/tree_map/video-game-sales-data.json'
var videoGameData;

//Create Canvas
var canvas = d3.select('#canvas');

var canvasDimension = {
    width: 1200,
    height: 600
};

//Color Array
var color = {
    color: ['orange' , 'yellow', 'red', 'pink', 'indigo', 'crimson',
            'brown', 'lightgreen', 'green', 'darkblue', 'steelblue',
            'darkcyan', 'darkviolet', 'firebrick', 'pink', 'gold', 'khaki',
            'tan'],
    console: ['Atari 2600', 'Nintendo 64', 'Wii', 'NES', 'Super NES', 'GameBoy',
            'GameBoy Advance', 'Nintendo DS', 'Nintendo 3DS', 'XBOX', 'XBOX One',
            'XBOX 360', 'Playstation One', 'Playstation 2', 'Playstation 3', 'Playstation 4',
            'PC', 'Playstation Portable'],
    atari: 'orange',
    nintendo64: 'yellow',
    wii: 'red',
    nes: 'pink',
    snes: 'indigo',
    gb: 'crimson',
    gba: 'brown',
    ds: 'lightgreen',
    ds3: 'green' ,
    xbox: 'darkblue',
    xone: 'steelBlue',
    xbox360: 'darkcyan',
    ps: 'darkviolet',
    ps2: 'firebrick',
    ps3: 'pink',
    ps4: 'gold',
    pc: 'khaki',
    psp:'tan',
}

function drawTreeMap(){}
3. Fetch the data from API
- Call the d3.json() method, giving the url of the json data
- Specify a function to run in .then() when the promise is resolved, that takes in the data (d3 has converted from json to javascript object) and any errors
- If there is an error, log it, otherwise set the movieData variable to the data
- Finally, run the drawTreeMap() method to use the data to draw the treemap
1
2
3
4
5
6
7
8
9
10
11
12
13
14
d3.json(videoGameUrl).then(
(data, error) => {
if(error){
console.log(error);
} else {
videoGameData = data;
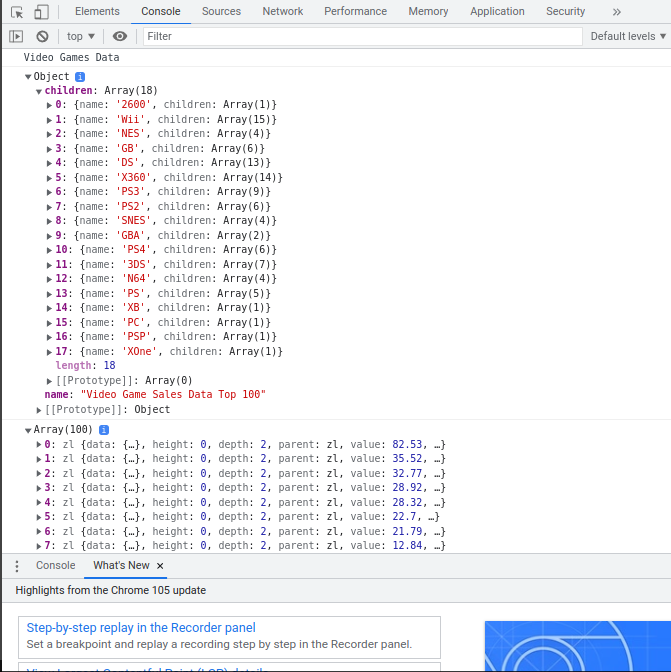
console.log('Video Games Data')
console.log(videoGameData);
drawTreeMap();
}
}
)
4. Create title and description with corresponding ids
- Create an element anywhere in the document with an id of ‘title’
1
2
3
<h1 id="title">
    <strong><i>Video Games Sales</i></strong>
</h1>
- Create an element anywhere in the document with an id of ‘description’
1
2
3
<div id="rightSide">
    <svg id="legend"></svg>
</div>
5. Create rectangle with corresponding class “tile” representing the data
Creating a Hierarchy:
- We first have to create a ‘hierarchy’ with our data to tell d3 how to order things and how to determine the areas of items
- We do this by calling the d3.hierarchy() method. We give this two arguments. Firstly, the data object videoGameData which we imported earlier, and secondly a function to point it to where the child nodes are → here they are in an array called ‘children’ so we return that
- We then call the sum() method on this hierarchy, where we give it a function that takes in one of the items/nodes of the tree, in this case, a video game and tell it from where we should determine the area. We want this to be based on the value, since a larger value should create a larger block. So point this to return the ‘value’ field.
- We then call the sort() method on this hierarchy to specify how we should order the data. This is given a function that takes in any two nodes. We subtract and return the value of node 1 from node 2. If this is positive, node 2 has a higher value and should be ahead, otherwise node 1 should be ahead
1
2
3
4
5
6
7
let hierarchy = d3.hierarchy(videoGameData, (data) => {
    return data['children'];
}).sum((data) => {
    return data.value;
}).sort((node1, node2) => {
    return node2.value - node1.value;
})
- We can use the d3.treemap() method on this hierarchy to generate the dimensions of our rectangles based on the data
- Firstly, call the d3.treemap() method
- Then call the size() method on this to set the treemap size to be the same as our canvas
- This returns a method we can call on a hierarchy to add the properties to create rectangles from it, so call this on the hierarchy we created earlier
- Now the hierarchy has some properties added for rectangle dimensions
- Call the .leaves() method on the hierarchy to get an array of objects for each movie with the dimensions we need and assign this to a variable
1
2
3
4
5
6
7
8
9
10
11
//Create the treemap
let treeMap = d3.treemap()
                .size([canvasDimension.width, canvasDimension.height])
                .paddingInner(2);

//Initialize treemap
treeMap(hierarchy);

//Store sorted data
videoGameTiles = hierarchy.leaves();
console.log(videoGameTiles);
- If we look at this array, we can see that there is an object for each video game
- x0, y0 determines where the top left corner of it’s rectangle should be
- x1, y1 determines where the top right corner of it’s rectangle should be
- The data object contains the other information associated with the video game, namely it’s name, category and revenue
- This is all we need to create our diagram
Creating tiles:
- We are using ‘‘g’ here instead of direct rectangles since we want to add text to the tiles
- Select all the g on the canvas and assign this to the variable blocks
- Associate them with the videoGameTiles array
- Call enter() to determine what to do for each movie where there isn’t a g element
- Create a new g element with the append() method and type of ‘g’
- Append each block with a ‘rect’ element to create a rectangle in each block
- Set the class of the rectangle to ‘tile’
1
2
3
4
5
6
7
let tile = canvas.selectAll('g')
                         .data(videoGameTiles)
                         .enter()
                         .append('g')

tile.append('rect')
            .attr('class', 'tile')
Create a bar for each data point in the set
6. Fill the tiles with differents colors
Add a ‘fill’ attribute to the rectangle selection like this:
- Select the ‘category’ field from the ‘data’ object from the movie item
- Return different color values based on the category
1
2
3
4
5
6
7
8
9
10
11
12
13
14
15
16
17
18
19
20
21
22
23
24
25
26
27
28
29
30
31
32
33
34
35
36
37
38
39
40
41
42
.attr('fill', (d) => {

                let category = d.data.category;

                if(category === '2600'){
                    return color.atari;
                } else if(category === 'Wii'){
                    return color.wii;
                } else if(category === 'NES'){
                    return color.nes;
                } else if(category === 'GB'){
                    return color.gb;
                } else if(category === 'DS'){
                    return color.ds;
                } else if(category === 'X360'){
                    return color.xbox360;
                } else if(category === 'PS3'){
                    return color.ps3;
                } else if(category === 'PS2'){
                    return color.ps2;
                } else if(category === 'SNES'){
                    return color.snes;
                } else if(category === 'GBA'){
                    return color.gba;
                } else if(category === '3DS'){
                    return color.ds3;
                } else if(category === 'N64'){
                    return color.nintendo64;
                } else if(category === 'PS4'){
                    return color.ps4;
                } else if(category === 'PS'){
                    return color.ps;
                } else if(category === 'XB'){
                    return color.xbox;
                } else if(category === 'PC'){
                    return color.pc;
                } else if(category === 'PSP'){
                    return color.psp;
                } else if(category === 'XOne'){
                    return color.xone;
                }
            })
7. Add some properties to each tile containing their corresponding name, category and value
Add these attributes to the rectangle selection:
- Set ‘data-name’ attribute to return the ‘name’ field from the ‘data’ object of the movie item
- Set ‘data-category’ attribute to return the ‘category’ field from the ‘data’ object of the movie item
- Set ‘data-value’ attribute to return the ‘value’ field from the ‘data’ object of the movie item
1
2
3
4
5
6
7
8
9
.attr('data-name', (d) => {
                return d.data.name;
            })
            .attr('data-category', (d) => {
                return d.data.category;
            })
            .attr('data-value', (d) => {
                return d.data.value;
            })
8. Attribute tile’s area in function of their value
Set the coordinates of the blocks:
- Apply a translate transformation to the ‘g’ blocks
- Give it a function to take in an item from the movieTiles array (a movie)
- Translate it along the x axis by x0 and y axis by y0, so that the top left corner of the block is at x0, y0
1
2
3
4
5
6
7
let tile = canvas.selectAll('g')
                         .data(videoGameTiles)
                         .enter()
                         .append('g')
                         .attr('transform', (d) => {
                            return 'translate (' + d.x0 + ', ' + d.y0 + ')';
                         })
Dynamically set the coordinates for each bar
Set the dimensions of the rectangles:
- To the rectangle selections, set the width to x1 - x0 (left side is at x=x0 and right side at x=x1)
- Set the height to y1-y0 (top is at y = y0 and bottom is at y=y1)
- Now the top left corner is at x0,y0 and the bottom right corner is at x1,y1
1
2
3
4
5
6
.attr('width', (d) => {
                return d.x1 - d.x0;
            })
.attr('height', (d) => {
                return d.y1 - d.y0;
            })
Dynamically set the height of each bar
(Optional) Add some text labels:
- Append each ‘g’ block with a text element
- Set the text inside by calling text() and returning the ‘name’ field from the ‘data’ object of the movie item
- Set some x and y attributes to make the text seen in the blocks
1
2
3
4
5
6
7
8
9
10
11
12
13
14
15
tile.append('text')
            .attr('class', 'game-title')
            .selectAll('tspan')
            .data(function (d) {
              return d.data.name.split(/(?=[A-Z][^A-Z])/g);
            })
            .enter()
            .append('tspan')
            .attr('x', 4)
            .attr('y', function (d, i) {
              return 13 + i * 10;
            })
            .text(function (d) {
              return d;
            });
9. Create a legend with a corresponding id, for each rectangle element give an appropriate and class and fill it with a given color
- Create an svg element with the id of ‘legend’ anywhere in your document:
1
2
3
<div id="rightSide">
    <svg id="legend"></svg>
</div>
- Create a rect element with the class of ‘legend-item’
- Add some text to represent what each rectangle means
- Use the same fill colors as the the rectangles in the treemap
- You might have to increase the min-height of the legend to see everything
1
2
3
4
5
6
7
8
9
10
11
12
13
14
15
16
17
18
19
20
21
22
23
24
25
26
27
28
29
30
31
32
33
34
function drawLegend() {

    legendContainer.attr('width', legendDimension.width)
                   .attr('height', legendDimension.height);

    let legend = legendContainer.selectAll('g')
                                .data(color.color)
                                .enter()
                                .append('g')
                                .attr('class', 'legend-box');

    legend.append('rect')
          .attr('class', 'legend-item')
          .attr('x', 10)
          .attr('y', (d, i) => {
            return i*40;
          })
          .attr('width', 40)
          .attr('height', 20)
          .attr('fill', (d) => {
            return d;
          })

    legend.append('text')
          .attr('x', 60)
          .attr('y', (d, i) => {
            return 15 + i*40;
          })
          .attr('fill', 'white')
          .attr('class', 'legend-text')
          .text((d, i) => {
            return color.console[i];
          })
}
10. Create a tooltip and some properties to it
- Create a div element in the document with the id of tooltip
1
<div id="tooltip"></div>
- Set the variable tooltip to a d3 selection of tooltip
1
let tooltip = d3.select('#tooltip');
- Set the css of the tooltip div to opacity null, width and height auto
1
2
3
4
5
6
7
8
9
10
11
12
13
14
15
16
#tooltip {
    position: absolute;
    padding: .5rem;
    text-align: center;
    font: 'Roboto', sans-serif;
    border-radius: .3rem;
    border: solid 1px green;
    opacity: 0;
    background: #eaeaea;
    box-shadow: 4px 4px 6px rgba(0, 0, 0, 0.4);
    display: flex;
    font-size: 14px;
    align-items: center;
    justify-content: center;
    flex-direction: column;
}
- Add a mouseover event to blocks to make the tooltips visible
- Return the information from the ‘data’ field of the movie
- It doesn’t really matter what the tooltip text contains
- Add a mouseout event to the blocks to make the tooltips hidden
1
2
3
4
5
6
7
8
9
10
11
12
13
14
15
16
17
18
19
20
21
22
.on('mouseover', (d, i) => {

                            //Create Tooltip
                            let tooltip = d3.select('#tooltip');

                            tooltip.transition()
                                    .duration(200)
                                    .style('opacity', 0.8);

                            tooltip.html("" + "Name: " + d.data.name + "<br/>" +
                                        "Value: " + d.data.value + "<br/>" +
                                        "Category: " + d.data.category + "<br/>");

                            tooltip.style('left', (d3.event.pageX + 10) + 'px')
                                   .style('top', (d3.event.pageY - 28) + 'px');

                         })
                         .on('mouseout', (d) => {
                            tooltip.transition()
                                    .duration(200)
                                    .style('opacity', 0)
                         });
- In the mouseover event in the block call the attribute method on tooltip
- Set the attribute ‘data-value’ to the ‘value’ field from the data object in the video game
1
tooltip.attr('data-value', d.data.value);
11. Final touches and CSS styling
Source Code
index.html
1
2
3
4
5
6
7
8
9
10
11
12
13
14
15
16
17
18
19
20
21
22
23
24
25
26
27
28
29
30
31
32
<!DOCTYPE html>
<html lang="en">
<head>
    <meta charset="UTF-8">
    <meta http-equiv="X-UA-Compatible" content="IE=edge">
    <meta name="viewport" content="width=device-width, initial-scale=1.0">
    <title>Tree map</title>
    <script src="https://d3js.org/d3.v5.min.js"></script>
    <link rel="stylesheet" href="./style.css">
</head>
<body>
    <h1 id="title">
        <strong><i>Video Games Sales</i></strong>
    </h1>
    <div id="description">Top 100 Video Games Sales sorted by Console</div>
    <div id="tooltip"></div>
    <div id="main-wrapper">
        <div id="leftSide">
            <svg id="canvas">
            </svg>

            <div id="signature">Made by Venom Cocytus</div>
        </div>

        <div id="rightSide">
            <svg id="legend">
            </svg>
        </div>
    </div>
</body>
<script defer src="./script.js"></script>
</html>
style.css
1
2
3
4
5
6
7
8
9
10
11
12
13
14
15
16
17
18
19
20
21
22
23
24
25
26
27
28
29
30
31
32
33
34
35
36
37
38
39
40
41
42
43
44
45
46
47
48
49
50
51
52
53
54
55
56
57
58
59
60
61
62
63
64
65
66
67
68
69
70
71
72
73
74
75
76
77
78
79
80
81
82
83
84
85
86
87
88
89
90
91
92
93
94
95
96
97
98
99
100
101
102
@import url('https://fonts.googleapis.com/css?family=Roboto');

* {
    font-family: 'Roboto', sans-serif;
    min-height: 100%;
}

body {
    background-image: radial-gradient( circle 610px at 5.2% 51.6%,  rgba(5,8,114,1) 0%, rgba(7,3,53,1) 97.5% );
    display: flex;
    flex-direction: column;
    align-items: center;
    text-align: center;
    justify-content: center;
}

svg {
    background-color: rgb(56,58,74);
    margin: 10px;
}

#legend {
    border-radius: 3px;
    margin: 10px;
    padding: 10px;
    display: flex;
    flex-direction: column;
    align-items: center;
    font-size: 15px;
    border-radius: 8px;
}

.legend-text {
    font-size: 12px;
}

.game-title {
    font-size: 10px;
}

.legend-box {
    display: flex;
    flex-direction: row;
    align-items: center;
    justify-content: center;
}

#main-wrapper{
    display: flex;
    align-items: center;
    width: 100%;
}

#canvas {
    min-width: 1000px;
    min-height: 600px;
}

#title, #description {
    text-align: center;
    padding: 10px;
}

#title {
    font-weight: bold;
}

#tooltip {
    position: absolute;
    padding: .5rem;
    text-align: center;
    font: 'Roboto', sans-serif;
    border-radius: .3rem;
    border: solid 1px green;
    opacity: 0;
    background: #eaeaea;
    box-shadow: 4px 4px 6px rgba(0, 0, 0, 0.4);
    display: flex;
    font-size: 14px;
    align-items: center;
    justify-content: center;
    flex-direction: column;
}

.tile{
    cursor: pointer;
}

.tile:hover {
    fill: darkred;
}

#leftSide {
    display: flex;
    flex-direction: column;
    align-items: center;
}

#signature {
    font-size: 12px;
    margin: 20px;
}
script.js
1
2
3
4
5
6
7
8
9
10
11
12
13
14
15
16
17
18
19
20
21
22
23
24
25
26
27
28
29
30
31
32
33
34
35
36
37
38
39
40
41
42
43
44
45
46
47
48
49
50
51
52
53
54
55
56
57
58
59
60
61
62
63
64
65
66
67
68
69
70
71
72
73
74
75
76
77
78
79
80
81
82
83
84
85
86
87
88
89
90
91
92
93
94
95
96
97
98
99
100
101
102
103
104
105
106
107
108
109
110
111
112
113
114
115
116
117
118
119
120
121
122
123
124
125
126
127
128
129
130
131
132
133
134
135
136
137
138
139
140
141
142
143
144
145
146
147
148
149
150
151
152
153
154
155
156
157
158
159
160
161
162
163
164
165
166
167
168
169
170
171
172
173
174
175
176
177
178
179
180
181
182
183
184
185
186
187
188
189
190
191
192
193
194
195
196
197
198
199
200
201
202
203
204
205
206
207
208
209
210
211
212
213
214
215
216
217
218
219
220
221
222
223
224
225
226
227
228
229
230
231
232
233
234
235
236
237
238
239
240
241
242
243
244
//Variable's declaration

//Fetching data from the Api
var videoGameUrl = 'https://cdn.freecodecamp.org/testable-projects-fcc/data/tree_map/video-game-sales-data.json'
var videoGameData;

//Create Canvas
var canvas = d3.select('#canvas');
var canvasDimension = {
    width: 1200,
    height: 600
};

//Create Legend
var legendContainer = d3.select('#legend');
var legendDimension = {
    width: 200,
    height: 700
}

//Color Array
var color = {
    color: ['orange' , 'yellow', 'red', 'pink', 'indigo', 'crimson',
            'brown', 'lightgreen', 'green', 'darkblue', 'steelblue',
            'darkcyan', 'darkviolet', 'firebrick', 'pink', 'gold', 'khaki',
            'tan'],
    console: ['Atari 2600', 'Nintendo 64', 'Wii', 'NES', 'Super NES', 'GameBoy',
            'GameBoy Advance', 'Nintendo DS', 'Nintendo 3DS', 'XBOX', 'XBOX One',
            'XBOX 360', 'Playstation One', 'Playstation 2', 'Playstation 3', 'Playstation 4',
            'PC', 'Playstation Portable'],
    atari: 'orange',
    nintendo64: 'yellow',
    wii: 'red',
    nes: 'pink',
    snes: 'indigo',
    gb: 'crimson',
    gba: 'brown',
    ds: 'lightgreen',
    ds3: 'green' ,
    xbox: 'darkblue',
    xone: 'steelBlue',
    xbox360: 'darkcyan',
    ps: 'darkviolet',
    ps2: 'firebrick',
    ps3: 'pink',
    ps4: 'gold',
    pc: 'khaki',
    psp:'tan',
}

//DrawCanvas
function drawCanvas() {

    canvas.attr('width', canvasDimension.width)
          .attr('height', canvasDimension.height);
}

//Draw Legend
function drawLegend() {

    legendContainer.attr('width', legendDimension.width)
                   .attr('height', legendDimension.height);

    var legend = legendContainer.selectAll('g')
                                .data(color.color)
                                .enter()
                                .append('g')
                                .attr('class', 'legend-box');

    legend.append('rect')
          .attr('class', 'legend-item')
          .attr('x', 10)
          .attr('y', (d, i) => {
            return i*40;
          })
          .attr('width', 40)
          .attr('height', 20)
          .attr('fill', (d) => {
            return d;
          })

    legend.append('text')
          .attr('x', 60)
          .attr('y', (d, i) => {
            return 15 + i*40;
          })
          .attr('fill', 'white')
          .attr('class', 'legend-text')
          .text((d, i) => {
            return color.console[i];
          })
}

//Draw Tree Map
function drawTreeMap() {

    //Create the treemap
    var treeMap = d3.treemap()
                    .size([canvasDimension.width, canvasDimension.height])
                    .paddingInner(2);

    //Define a hierarchy for the data
    var hierarchy = d3.hierarchy(videoGameData, (data) => {
        return data['children'];
    }).sum((data) => {
        return data.value;
    }).sort((node1, node2) => {
        return node2.value - node1.value;
    })

    //Initialize treemap
    treeMap(hierarchy);

    //Store sorted data
    videoGameTiles = hierarchy.leaves();
    console.log(videoGameTiles);

    //Render Tiles
        var tile = canvas.selectAll('g')
                         .data(videoGameTiles)
                         .enter()
                         .append('g')
                         .attr('transform', (d) => {
                            return 'translate (' + d.x0 + ', ' + d.y0 + ')';
                         })
                         .on('mouseover', (d, i) => {

                            //Create Tooltip
                            var tooltip = d3.select('#tooltip');

                            tooltip.transition()
                                    .duration(200)
                                    .style('opacity', 0.8);

                            tooltip.html("" + "Name: " + d.data.name + "<br/>" +
                                        "Value: " + d.data.value + "<br/>" +
                                        "Category: " + d.data.category + "<br/>");

                            tooltip.style('left', (d3.event.pageX + 10) + 'px')
                                   .style('top', (d3.event.pageY - 28) + 'px');

                            tooltip.attr('data-value', d.data.value);
                         })
                         .on('mouseout', (d) => {
                            tooltip.transition()
                                    .duration(200)
                                    .style('opacity', 0)
                         });

        tile.append('rect')
            .attr('class', 'tile')
            .attr('data-name', (d) => {
                return d.data.name;
            })
            .attr('data-category', (d) => {
                return d.data.category;
            })
            .attr('data-value', (d) => {
                return d.data.value;
            })
            .attr('fill', (d) => {

                var category = d.data.category;

                if(category === '2600'){
                    return color.atari;
                } else if(category === 'Wii'){
                    return color.wii;
                } else if(category === 'NES'){
                    return color.nes;
                } else if(category === 'GB'){
                    return color.gb;
                } else if(category === 'DS'){
                    return color.ds;
                } else if(category === 'X360'){
                    return color.xbox360;
                } else if(category === 'PS3'){
                    return color.ps3;
                } else if(category === 'PS2'){
                    return color.ps2;
                } else if(category === 'SNES'){
                    return color.snes;
                } else if(category === 'GBA'){
                    return color.gba;
                } else if(category === '3DS'){
                    return color.ds3;
                } else if(category === 'N64'){
                    return color.nintendo64;
                } else if(category === 'PS4'){
                    return color.ps4;
                } else if(category === 'PS'){
                    return color.ps;
                } else if(category === 'XB'){
                    return color.xbox;
                } else if(category === 'PC'){
                    return color.pc;
                } else if(category === 'PSP'){
                    return color.psp;
                } else if(category === 'XOne'){
                    return color.xone;
                }
            })
            .attr('width', (d) => {
                return d.x1 - d.x0;
            })
            .attr('height', (d) => {
                return d.y1 - d.y0;
            })

        tile.append('text')
            .attr('class', 'game-title')
            .selectAll('tspan')
            .data(function (d) {
              return d.data.name.split(/(?=[A-Z][^A-Z])/g);
            })
            .enter()
            .append('tspan')
            .attr('x', 4)
            .attr('y', function (d, i) {
              return 13 + i * 10;
            })
            .text(function (d) {
              return d;
            });
}


//Main
d3.json(videoGameUrl).then(
    (data, error) => {
        if(error){
            console.log(error);
        } else {

            videoGameData = data;
            console.log('Video Games Data')
            console.log(videoGameData);

            drawCanvas();
            drawLegend();
            drawTreeMap();
        }
    }
)
Interactive frame
Links
Getting The Code On CodePen
The entire codePen containing all the code mentioned in this post can be found here.
Getting The Code On Github
The entire folder containing all the code mentioned in this post can be found via this link.
Just bear in mind that you will need to install all the dependencies. If you find any issues with the code, feel free to either comment down below or raise an issue on Github.
Add me on LinkedIn
Don’t hesitate to follow me on linkedIn or o other social network to encourage me to do more posts on IT.
Comments powered by Venom Cocytus.